Lower Mount Emu Creek Flood Investigation
Lower Mount Emu Creek will be the focus of the Glenelg Hopkins CMA’s work through the Victorian Government’s Flood Reclamation Roadmap (Fast Tracking Flood Studies in Regional Victoria) in 2025-2027.
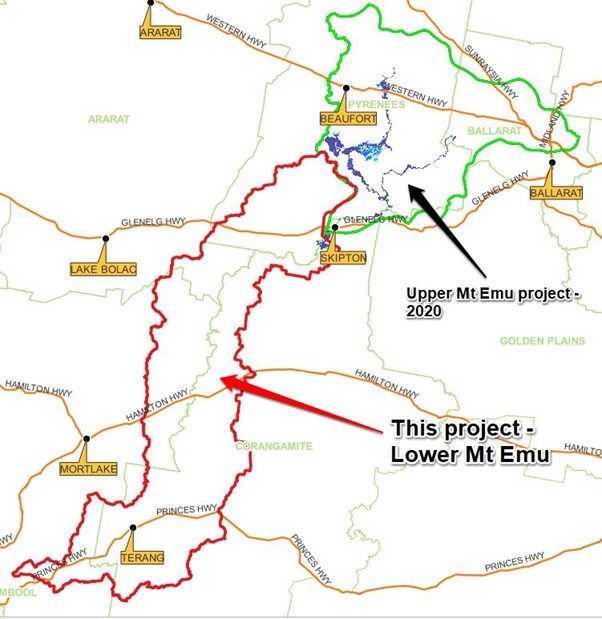
The focus will be on the 1870 square km area of the Lower Mt Emu Creek, and covers the Mt Emu Creek floodplain across 4 council areas (Moyne, Ararat, Pyrenees and Corangamite). The red boundary in the map below shows the area covered.
This will be the biggest flood investigations we’ve ever done for the region in terms of the size of the area to be modelled.
The primary output from the project will be high reliability flood risk mapping produced by computer modelling. By the end of the project around April/May 2027, we’ll have mapping that for the first time, covers the entire floodplain between Skipton and Mt Emu Creek/Hopkins River junction – a few km’s downstream of Panmure.
The new maps will build on the maps produced for the Upper Mt Emu Creek floodplain in 2020, which covered the floodplain from Trawalla down to Skipton.
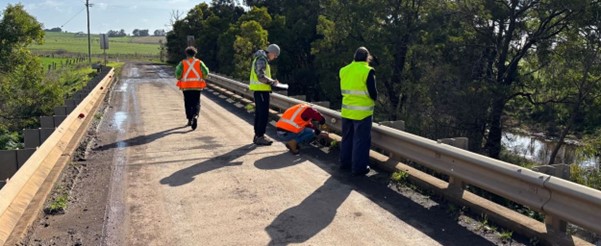
The Glenelg Hopkins CMA project team and the project consultants, Venant Solutions, began the project on September 3, 2025, with a tour to gather key information on floodplain features including bridges, historic flood levels and stream gauges.
Covering an area this big wasn’t dreamt of 15 years ago because of how long it would take a computer model to run.
Graeme Jeffery,
These days, we can model much bigger areas more efficiently due to advancements in computer speeds driven by the gaming industry.
Glenelg Hopkins CMA | Senior Statutory Planner | Waterways
Project activity timeline
2025-2026
Catchment tour (GHCMA and Venant)
Project inception meeting (all PRG members)
PRG meeting and Community session #1
Data review
Draft flood modelling
PRG meeting and Community session #2
Final flood mapping
Planning Scheme Amendment mapping
2027
Flood Damages and Mitigation Assessment
PRG meeting and Community session #3
Flood Emergency response and resilience information
Project Summary report
PRG meeting and Community session #4
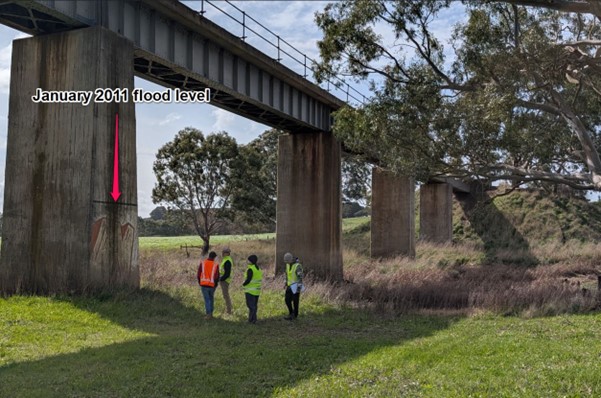
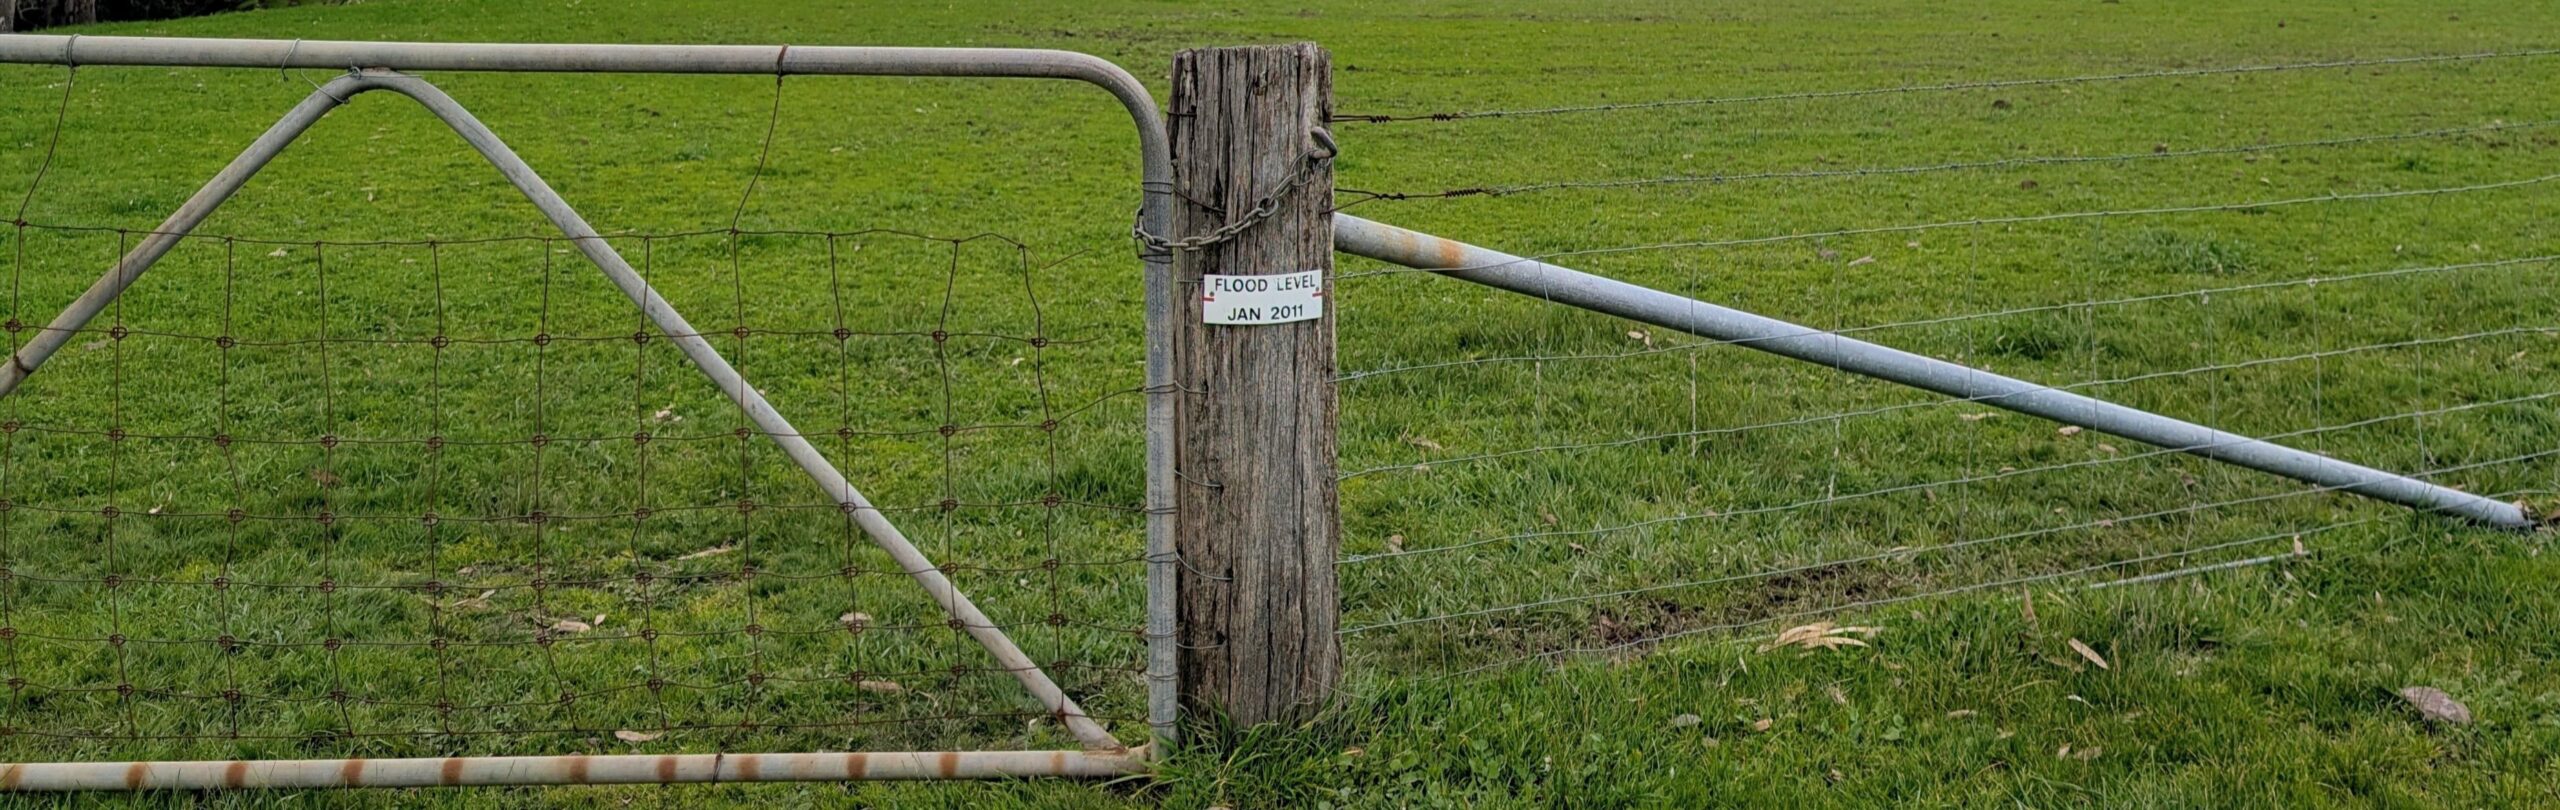
ABOVE: Project day 1 catchment tour (3 September 2025) – visit to the January 2011 flood level mark on the railway bridge at Boorcan.
Call for community knowledge
The impacts of flooding can range from minor and major transport disruptions when roads get flooded, through to stock, crop and fencing losses, damage to homes and shedding and in the most serious circumstances, loss of lives.
A big focus of the project is to gather community’s knowledge and experience of flooding in the area, and to use this knowledge to ensure the maps produced by the computer model show what we can expect in real life.
Did you know?
Historical records, including photos, flood levels – even those community or household ones like a nail in a post or a mark on a wall, and rainfall records, that you have kept individually or as a family – can be a big help ensure the new flood maps are reliable.
It all helps to back up, support, or provide an alternate view of flood data.
Got records?
If you have or know of any records like this, we’d love to hear from you.
Connect with the project team
Email: planning@ghcma.vic.gov.au
OR
Phone Erin Wilson on 0475 218 176
Interested in learning more?
Community Session #2
Our second community information session will be held in June 2026. Stay tuned for more details closer to the time.